GAVO SPLAT
The VO elements of SPLAT are now being developed by the GAVO (German
Astrophysical Virtual Observatory) in cooperation with the Astronomical
Institute of the Academy of Sciences of the Czech Republic. There is a
web page describing this effort at:
Beta-test releases of SPLAT may become available. A mailing list for the
discussion of these developments is also available at:
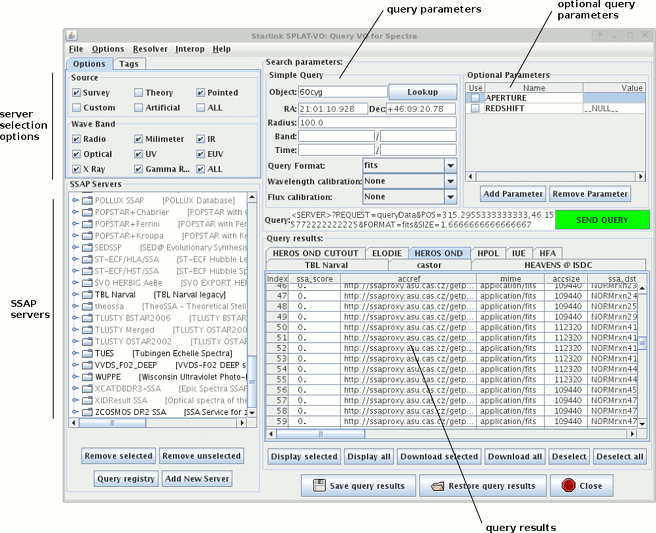
Starlink SPLAT-VO

SPLAT has been extended to include facilities that allow it to work as
part of the Virtual Observatory (VO). These facilities come in two
different forms, one for querying and downloading spectra from SSAP
servers and one for interoperating with VO tools, such as TOPCAT, on
your desktop using SAMP.
The SAMP facilities have been developed by
Mark Taylor and the SSAP
ones by myself and
Margarida Castro Neves.
The main changes in the release available here are the work of
Margarida (these are some of the effort described at GAVO SPLAT).
This latest version of SPLAT is available as a download for installing
onto your desktop:
SPLAT-VO installer (130Mb)
or as a webstart application:
SPLAT-VO webstart
The changes are described in the
NEWS
file.
Both versions will run using Linux, Windows 10, Mac OS X
(10.6, i386). The installer is an executable jar file so you just need
to run this using the command:
java -jar splat-vo.jar
After downloading it.
If you install SPLAT-VO locally then it may integrate into your desktop
or alternatively (for UNIX only) you can run it by executing the
splat script located in the
<root>/bin/splat directory.
Windows users are required to permit the installer privilege so it
can install into system directories. Under Windows 10 you will need
to permit the installation of non-store apps.
March 2014: the latest releases of Oracle Java 7 have stopped running
webstart applications that have self-signed certificates. To work
around this you need to add "http://astro.dur.ac.uk/" to your exception
site list. This can be done using the security settings in the Java
console.
SPLAT-VO is part of the Starlink STARJAVA package and is available under
the GPL.
The complete documentation (which is also available in the on-line help)
is available as SUN/243
|