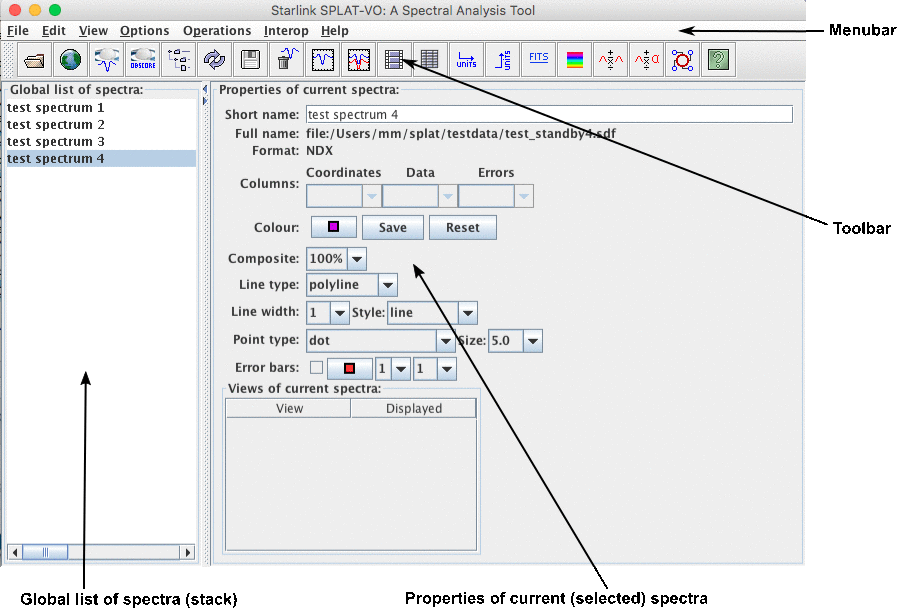
The browser window has several main elements, each of which is shown in the following figure:

Global list of spectra
In the Global list of spectra short names for each5 spectra are shown. The short
names are intended to allow the quick identification of spectra and can be modified
at any time by selecting the name and then typing a new name in the Short name
field (remember to press <Return> to make the change happen). Initially short
names are read from the TITLE or OBJECT properties of spectral data formats that
support these (i.e. NDF and FITS respectively), otherwise they default to the file
name.
Another important concept related to the global list, is using it to create a selected range or list of the spectra. Selection is important as this identifies which spectra you’d like to see properties for, or want to work with. There’s a quick tutorial on selecting spectra in the introductory material (§2.2).
Properties of current spectra
In the properties area there are controls for changing how the currently selected spectra are displayed (a spectrum always uses the same display properties) and where they are displayed.
If more than one spectrum is selected then the properties shown are those of the first spectrum (i.e. highest in the global list). However, any changes that you then make are applied to all the selected spectra.
If you load a table into SPLAT-VO the Columns: controls will show the names of the columns selected. If these are incorrect then you can choose a different set.
The properties that you can change include the colour (press on this to get a swatch of selectable colours), the composite value (that is the transparency so you can see lines or points through other line or points), the line type (simple connected polyline or histogram, or just a point marker). If you choose to draw lines then you can set the width and style (dashed etc.). If you choose to draw points then various types are available.
If the selected spectra have errors then you can display error bars by clicking on the Error bars: control. This is greyed out if errors are not available. The colour, number of sigma drawn and frequency of the error bars can be changed using the other controls on this line.
Views of current spectra
The views of the current spectra region shows the names of the plots that are displaying the currently selected spectra (this time if a plot is showing only some of the spectra, then it is highlighted in red). To add a spectrum or list of spectra to a plot, select their names in the global list and then click on the Displayed control (normally this results in a tick appearing). If a plot is already displaying some of the selected spectra then you force it to display them all by clicking twice – the first click removes the selected spectra and the second puts them all back, plus the ones not already shown.
To make a plot visible double click on its name. This should raise and deiconify it.
Toolbar and menus
The toolbar region has a series of buttons that act as short-cuts to many of the functions found in the main menus. Here’s a quick break down of what they do:
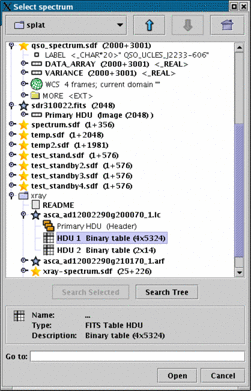
guess (either on the command-line or by
using the open file dialogue).

all the spectra in the global list. Each time you press this button
a new random seed is used to generate a different sequence of colours, so keep
pressing until you see a sequence you like.
Interesting menu items not found in the toolbar are a list of standard line position catalogues (for optical and some IR and submillimeter lines), these are found in Options->Line identifiers. Others are to do with controlling the selection of the spectra and plots (see the Edit menu, just like deleting spectra from the global list you can delete all the selected plots) and changing the ‘look and feel’ of SPLAT-VO. These options are found in the Options->Look and Feel and Options->Colour Theme sub-menus. Note that if you select the CDE/Motif look and feel you cannot change the colour and fonts used.
You can also save and restore the global stack of spectra to and from diskfile using a special data format that is only recognised by SPLAT-VO. Using this method allows you to save a working set of spectra and restart an analysis later. Properties such as the line colours are restored, but any relationship between disk files and the spectra in the global list is lost. Data saved in a stack are compressed.
The Interop menu contains items for communicating with other SAMP-aware desktop applications. This is described in the Tool interoperability section (§6).
Finer control of the initial coordinate system picked by SPLAT-VO is given by the
Options->Find spectral coordinates menu item. When this is selected (the default),
SPLAT-VO will check for any spectral coordinate system in the input spectra and use that,
if the default coordinate system isn’t spectral. It will also use any units it can locate to
attempt a guess if all else fails. Unfortunately this means that if you intend to
view another coordinate system (like GRID to see the channel numbers), it
might fail, so switching this off gives you complete control. This option can
also be enabled using the -k,--keepcoords switches on the command-line.
Accelerator keys