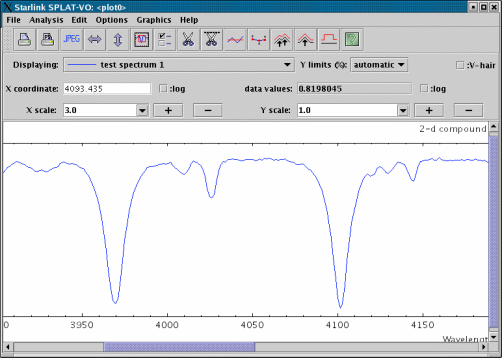
The final part of this introduction is to zoom and scroll the spectrum, so, for instance, you can inspect individual lines and read off accurate coordinates (this is after all the main purpose of SPLAT-VO).
Zooming of a plot is controlled by the X scale: and Y scale: controls. To adjust the zoom you may
either select a value from the drop-down lists, or you may type in a value and press <Return>. Values
may be non-integer, but should be one or more.
Once you have zoomed the plot scrollbars should appear at the bottom and maybe to the right (these appear when the size of the plot becomes larger than its visible size). Just drag the slider from side-to-side or up-and-down to view the part of the plot that you want to see.

A useful shortcut for zooming is to drag out a region using the middle mouse button. Just place your cursor on the plot, press the middle button and, keeping the button depressed, move the mouse until the rubber-band rectangle encloses the feature you want to zoom on. You can also zoom in by an increment of one in X and Y by pressing the middle button and just releasing it.
If you find that the figure is zoomed so much that you’re having difficulty recognising the features, then there are several things that you can do.
The first is to resize the plot so that it has a scale of 1 in X or Y. That’s what the toolbar buttons that
appear as  and
and  do, make the plot scale its displayed spectra to fit the visible width or
height. Note: These buttons are very useful when a plot seems to be displaying nothing or
reports that the plot has no size etc., they are your best friends, press them a lot in such
circumstances.
If what you really want to do is remain zoomed but quickly go to a given wavelength, then all you
need to do is type in the wavelength in the X-coordinate readout entry field (labelled Wavelength
above), press <Return> and the plot will be centred (or brought into the edge of the field of
view).
If what you’d really like is a smaller view of the whole plot to work from, then press the  button,
this will pop-up the ‘panner’. This shows a red rectangle over a view of the full unzoomed plot
(shown in the same aspect ratio as the full plot at the current scale factors). To move the rectangle, and
hence the view shown in the plot, just point somewhere in the panner and press the left mouse button,
or ‘drag’ the rectangle itself.
If the panner view seems very small, as can happen when you’re using a high X scale factor, then try resizing the window to get a better fit to the aspect ratio (hint: make it taller).
