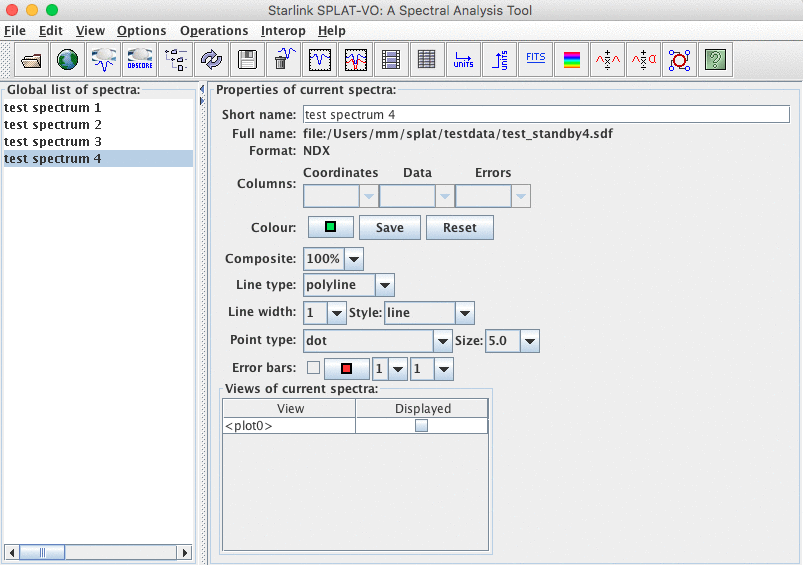
Displaying many spectra at the same time isn’t much more difficult than the single spectrum case. Just open up several spectra by giving their names on the command-line, or by opening them using the File->Open dialogue. This will produce a main window that looks something like:

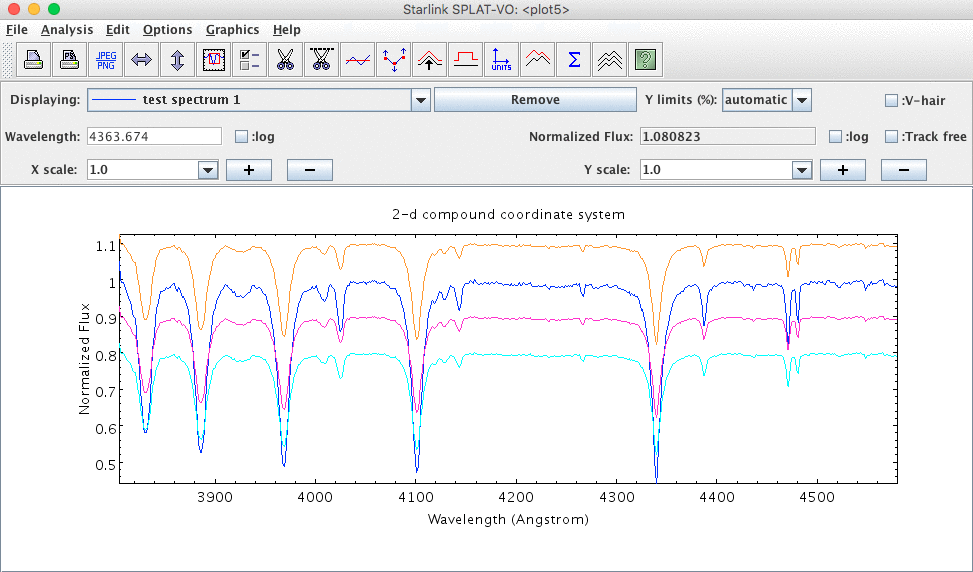
If you’ve opened all the spectra at once (you can do this using the File->Open dialogue by selecting more than one file – just hold down the shift key while selecting each one) then they will have also all appeared displayed in a single plot, which should look something like:

Again you should now close the plot (or all the plots if you’ve opened the spectra one-by-one) so you can find out how to add spectra to plots manually.
There are three ways to display a set of spectra in a single plot, you can either open a plot just displaying one spectrum and then add the others one-by-one, by two different methods, or you can open a plot displaying a pre-selected list of spectra. Let’s cover the latter option first.
The first thing to do is identify which spectra you want to display in the same plot, you do this by selecting their names in the Global list of spectra: list. You can select more than one name at a time by holding down the control key, while clicking on the name. It’s also possible to select ranges of names by selecting the first name and then selecting the last name while holding down the shift key. Have a play to see the effects that you can get with combinations of these (hint: using the control key also allows you to remove single names from the selection). To select all the names you can also use the Edit->Select all spectra menu item.
Now that you’ve selected the spectra to display, just press the multi-display button:  and all the
spectra will be displayed in a single plot. Note that if you inadvertently press the single display
button:
  , then each spectrum will appear in a plot of it’s own (this can be a very bad idea if you
have a very large number of spectra selected!).
If you don’t like the colours chosen for your spectra you can just press the auto-colour button:  to
get a new set. Each press of this button should generate a new set of colours, so just keep clicking until
you see a combination that you like.
The second method for adding more than one spectrum to a plot is the simplest, you can drag spectra from the Global list of spectra: and drop them into the display area of the plot. To drag a single spectrum just make sure that it is selected and then attempt to drag it from the Global list of spectra: into the plot (during dragging a document icon should be attached to your screen pointer). To drag more than one you just need to make all the spectra you want displayed selected and then attempt to drag any of the selected set.
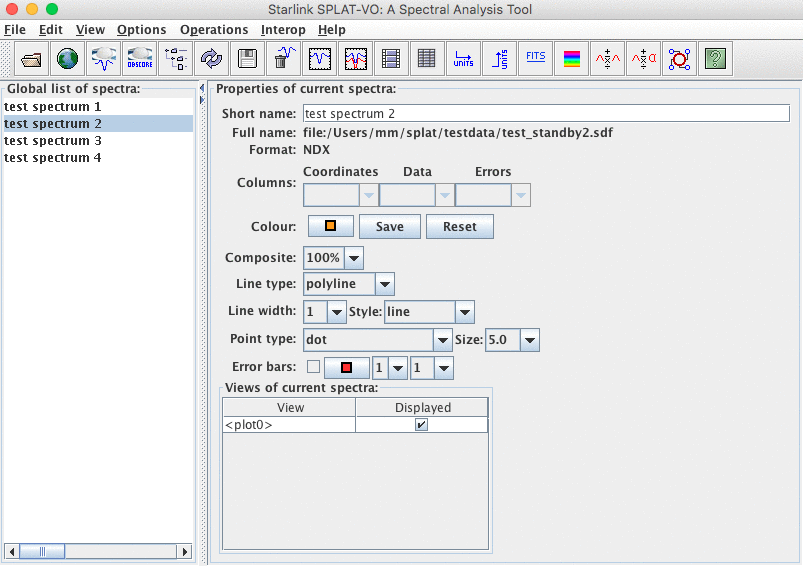
The third method is actually also the method you’d use to remove a spectrum from a plot. The first thing to do is select a spectrum in the Global list of spectra:, this shows its properties in the Properties of current spectra: side of the browser window, including which views are being made (i.e. which plots are displaying it).
If you click on one of the displayed spectra on a plot, the respective entry in the Global list of spectra: will be highlighted. By clicking on an entry at the Global list of spectra:, the respective plotted spectrum will blink a few times (if it’s plotted).
To add or remove a spectrum from a plot you need to click on the square shown in the Displayed
column, so that it becomes ticked or unticked. See in the following image that test spectrum 2 is
currently being displayed in <plot0>:

If any spectra were not displayed in this plot then they could be added to it using this mechanism. Naturally this also extends to the case when there are many plots available.