This window allows you to define the coordinate systems that describe your spectra. The most trivial use of these is simply to document what type of coordinate and units your spectra are measured in, examples are wavelength in air in angstroms, frequency in GHz, velocity in km/s, etc. When supplied these values will be used to annotate any plots, but can also be used to compare spectra in different coordinate systems and to transform a spectrum from one coordinate system to another.
A more complete description of the coordinate system also includes two further pieces of information, the time and place when the observation was made and the direction and speed of what was being observed. Taken together these define the ‘rest frames’ of the observation and the source.
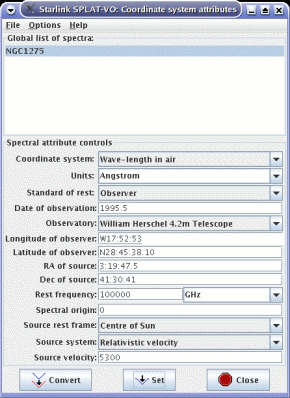
In the following picture you can see that I have an observation (topocentric) of NGC1275 (RA: 03:19:47.49, Dec: 41:30:40.5 FK5 J2000) made in air, calibrated in angstroms, taken in June 1999 on the William Herschel Telescope. I’ve also entered that NGC1275 as observed from the centre of the Sun (heliocentric) has a recessional (relativistic) velocity of 5300km/s. Alternatively if you know the necessary redshift you can enter that value by selecting a Source system of Redshift (other possibilities are radio velocity, optical velocity and beta factor).
To apply this to a spectrum that has no coordinate information (or incorrect coordinate information) you need to press the Set button. Note that you can apply the same coordinates to more than one spectrum by selecting them all in the view of the global list shown in this window.
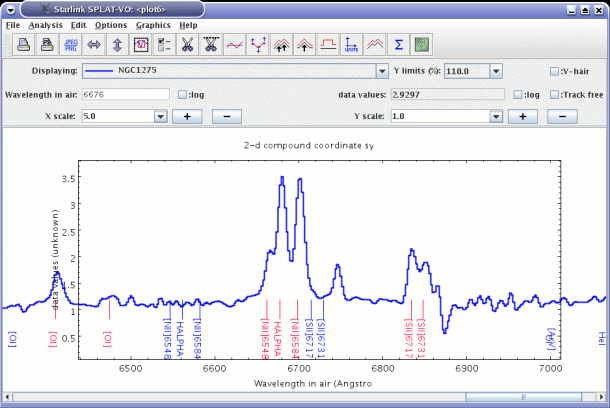
Now say that you wanted to compare this spectrum with a standard set of emission lines, obviously taken at rest in a laboratory. If you load the emission line catalogue and display it in the same plot (making sure that the Options->Match coordinates and/or fluxes item is switched on) the labels will be red-shifted to the rest frame of the source (i.e. where the lines from the galaxy originated). This is shown in action in the next figure where the lines before matching are shown in blue and red after matching.
The alternative to this method is switch Options->Match coordinates and/or fluxes off and transform the galaxy spectrum to what it would have looked like in the source standard of rest (i.e. if you had taken the measurements travelling with the galaxy). To do this change the Standard of rest: to Source but now press the Convert button. This remaps the spectral coordinates permanently.
Using this method you can also transform your spectrum to other systems and units (say frequency or energy) and rest frames (so you can go from topocentric to heliocentric or the kinematic or dynamic local standards of rest). With Options->Match coordinates and/or fluxes switched on you can also directly compare spectra calibrated in all these different systems.
When transforming to velocity (optical, radio and relativistic velocities are supported) a rest "frequency" is also needed. Conceptually this is the value that the centre of a line with locally zero velocity has. The rest frequency can actually be specified in various units, for instance angstroms.
The Spectral origin value is used when you want to draw spectral coordinates in some offset system. This value defines the zero point. It must be specified in the same units as the spectrum.
To find out more about spectral coordinate systems you’ll need to refer to ‘FITS-WCS paper III Representations of spectral coordinates in FITS (Greisen, Valdes, Calabretta & Allen)’ and the Starlink AST library documentation (SUN/211).
Accelerator keys