To start SPLAT-VO you should just need to type the command:
This assumes that you have SPLAT-VO installed on your system as part of a standard Starlink installation. If not then you’ll need follow any installation and pre-startup instructions that you have before using this command.
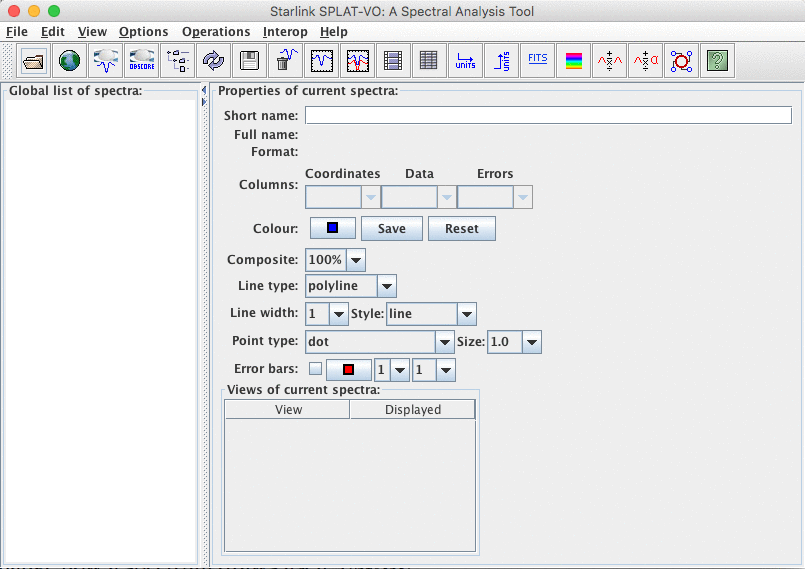
When SPLAT-VO appears it should look something like:

This is the main browser window. It has a list containing all the available spectra (in what we call the
‘global list’, but has been traditionally referred to as the ‘stack’). Using this window you can add, save
and remove spectra from the list, you can change how a spectrum draws itself, in all the
places that it is shown and make a spectrum add itself to a plot – this is how you view
spectra.
You can also do things like change the look and feel of the whole application (there are different colour and font schemes), perform some quite primitive mathematical operations on or between the spectra, run through an animated display sequence of some or all of the spectra, set the spectra coordinate systems and modify/inspect their values. So things that apply to each spectrum, wherever it is shown, or the program as a whole are generally done in this window.
To open your first spectrum select the Open item in the File menu. This will create a familiar open file dialogue window. Just navigate to your spectrum, select it, and press Open to proceed.
Alternatively you could have supplied the spectrum you want to use on the command-line:
Which will read the spectrum stored in the named file. SPLAT-VO will read spectra stored in most astronomical formats (Starlink NDF, FITS spectra and tables, VOTables, simple TEXT files).
Now that you’ve actually read in a spectrum it will be immediately displayed in a ‘plot’. Have a look at this plot window briefly, if you want, but close it before proceeding (to close it select the Close item in its File menu). You really need to understand how to display a spectrum in a plot yourself, if you’re to gain complete control over the creation of plots and what they display.
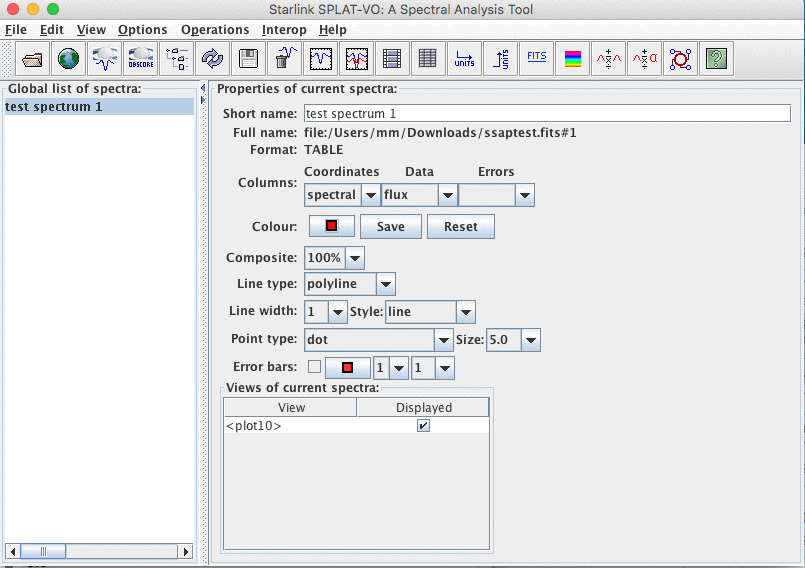
The browser window (once again on its own) should now appear something like:

Now to re-create a plot and display a spectrum in it the hard way. Actually this couldn’t
be simpler, just ‘double click’ on the name in the Global list of spectra. Another way to
achieve the same effect is to select the name (by just clicking on it once, you can tell it’s
selected when it becomes highlighted, as shown above) and choose the display selected
spectra button in the toolbar. This is the button that looks like  (it’s meant to represent
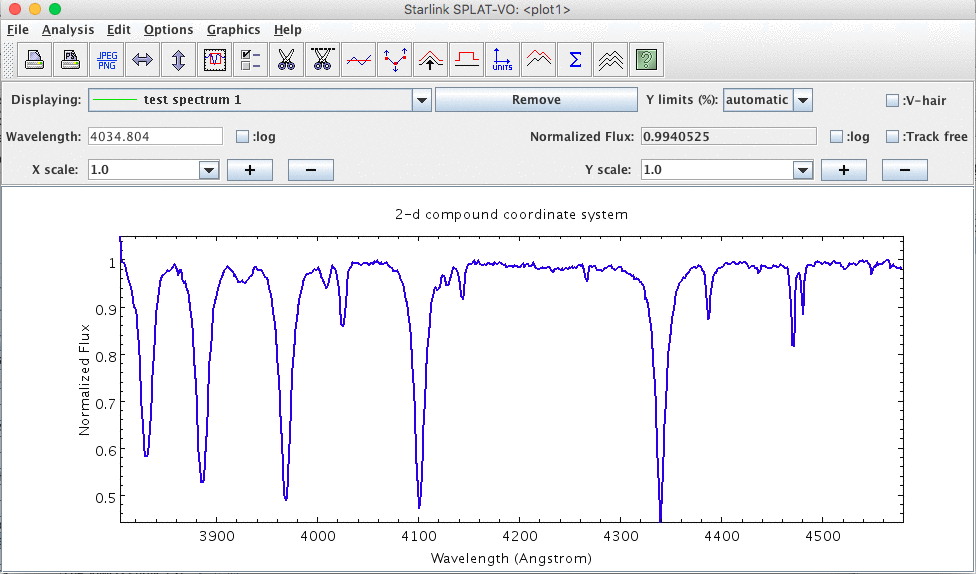
a spectrum with axes drawn in a plot). If you’re successful then a window looking like
this:

should appear as before.
Since SPLAT-VO is meant to be capable of displaying many spectra (sometimes in the same plot as we’ll see in the next section), you should confirm this by creating a second plot window, by just performing the same operation again (i.e. double click on the spectrum name).