
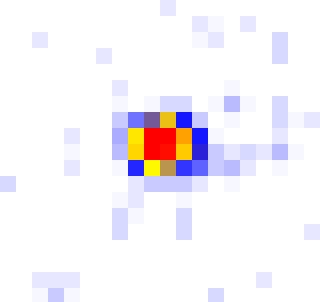
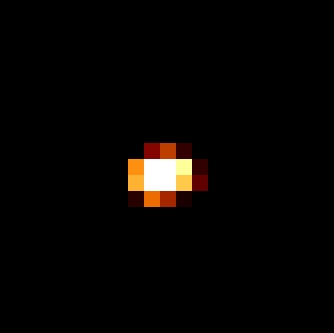
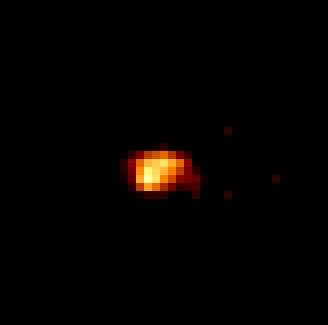
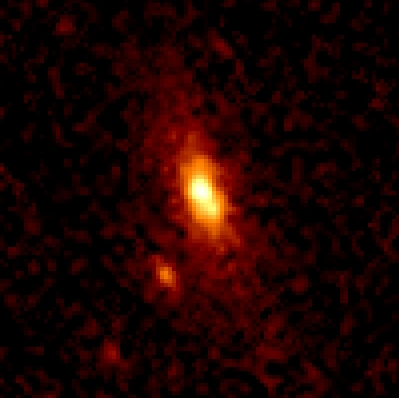
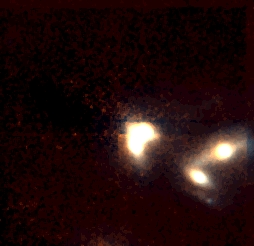
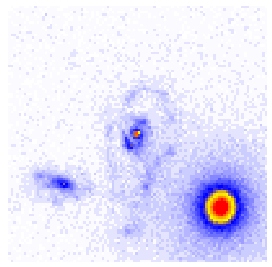
Below: The top two rows show the Chandra source CXOUJ215334.0+174240 as seen in hard X-rays (using two different false color maps and at two different pixel scales). The upper panels have 0.5-arcsec pixels, while the lower panels are resampled to 0.25-arcsec pixels. Both sets of panels are smoothed with a 0.8-arcsec FWHM gaussian for display purposes.
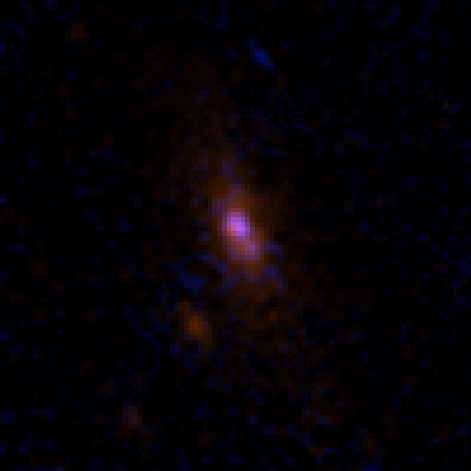
The lower three panels show the optical counterpart identified in an archival HST WFPC2 image of the field. The HST imaging is in F555W (V) and F814W (I) visual and near-infrared bands. The lower left-hand panel is a `true' color representation of the field, while the two right-hand panels show a false color view of the composite image using two different false color maps.
In all cases the panels are 10-arcsec square with North
top and East to the left. Note these images are JPEGs and the color
tables will look much better if viewed with a tool other than a browser.


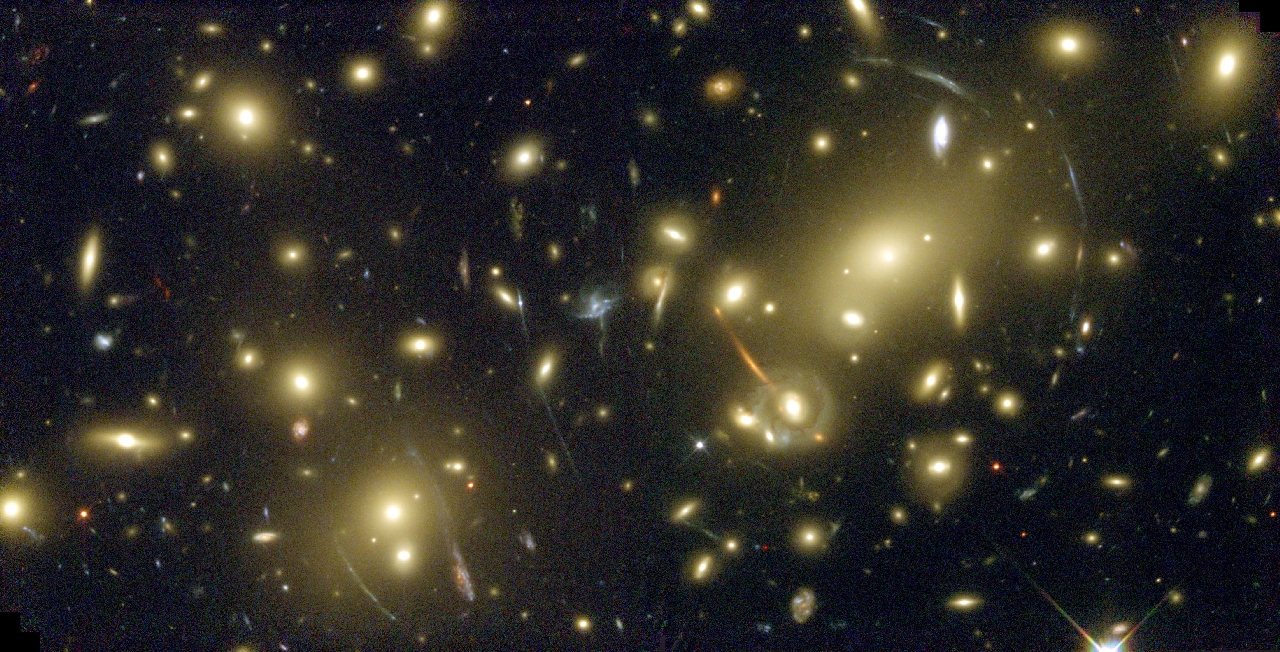
Below: A real color B/V/I image of the core
region of A2218 (z=0.171) taken with WFPC2/HST as an
Early Release Observation after SM3a. The various blue
high-z arcs are easily visible, as is the z=0.702 lensed
elliptical galaxy behind the cluster. This image comprises
15 orbits of exposure in F450W, F606W and F814W and
thus represents about $3M worth of data. However, overall this image
does not add significantly to our understanding of the arcs in
this cluster
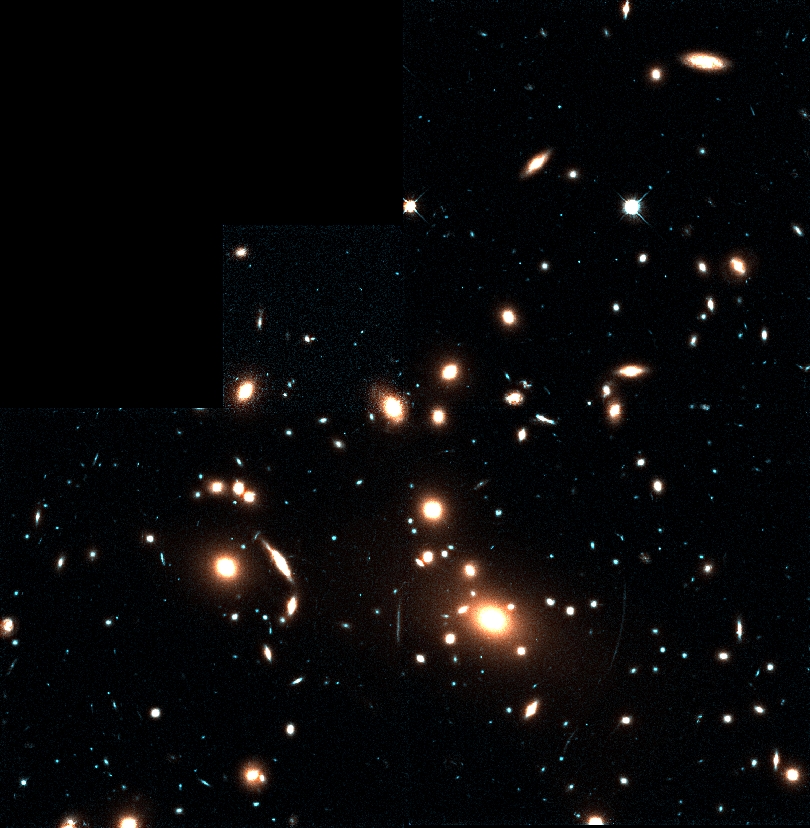
Below: A F702W image of the central 2.5× 2.5 arcmin
region of A2219 (z=0.225) taken with WFPC2/HST. This image has been
processed with ground-based B and I exposures to provide
color information on the galaxies in the field.
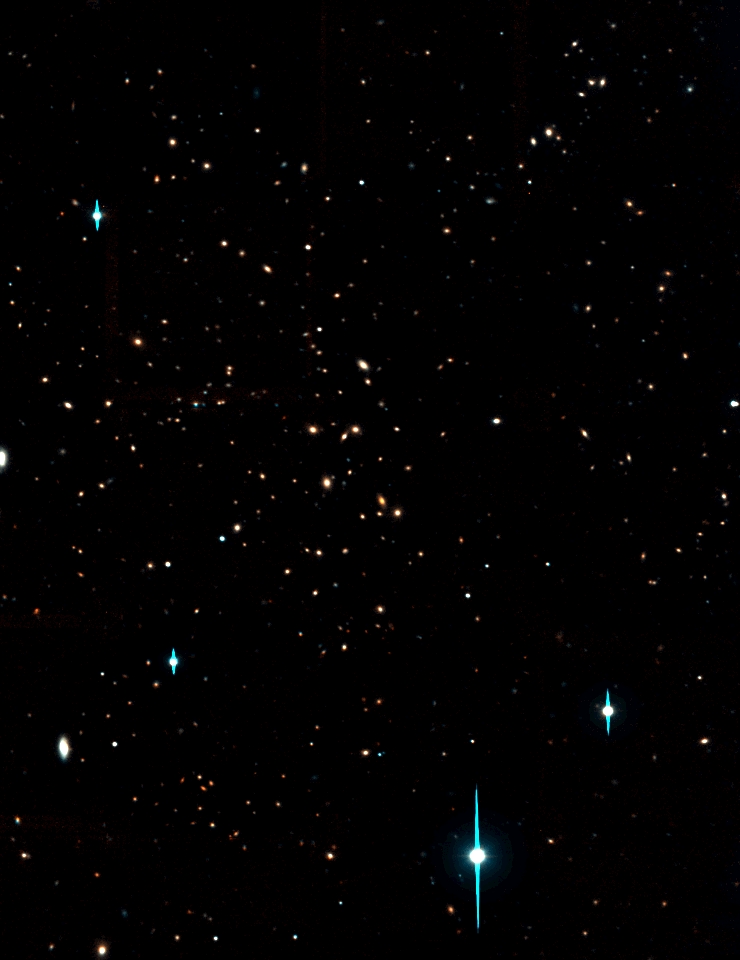
Below: A 7.5× 7.5 arcmin mosaic of A851 (z=0.41) taken
with WFPC2/HST for the MORPHS program. This figure shows the raw
shear field measured from the faint galaxies in the field overlayed
as a vector field along with a contour plot of the X-ray emission
from the cluster. The weak lensing signal suggests that the cluster
is very massive.
Below: A true color I/K image of A851 (z=0.41) constructed
from a wide-field 5x5 mosaic taken with UFTI on UKIRT in Feb/Mar 1999.
The full mosaic is 7.5× 7.5 arcmin in size with an effective
exposure time of 2.4ks per pointing (25 pointings) and a median seeing
of 0.5 arcsec FWHM for the whole mosaic (some frames are sub-0.4
arcsec). This subsection is 5.3× 6.8 arcmin to match the size of
the Keck I image (taken in collaboration with Len Cowie and Amy
Barger). The core of the cluster is dominated by half-a-dozen large
ellipticals (seen in the centre of the field).
Below: A false color K image of a single pointing
from the A851 UFTI mosaic. This frame is 92× 92 arcsec
in size, has an exposure time of 2.4ks and seeing of ~0.45 arcsec
(around 3 kpc at the cluster redshift for Ho=50/qo=0.5).
Weak spiral arms are visible in the bright galaxy in the center
of the frame and several of the other brighter galaxies can be easily
morphologically classified as S0 or E.
Below: A true color image of a 60 × 60 arcsec region
(roughly 400 kpc across at the cluster redshift) from the A851 UFTI
mosaic. The frame shows a compact clump of galaxies on the edge of the
cluster which are probably being accreted onto the cluster core. The
effects of dust are evident in the colours of several of the spiral
galaxies in the centre of the field as well as being seen in their HST
morphologies. The reddest of the three galaxies in the field centre is
also detected in a deep 1.4GHz VLA radio map of the cluster suggesting
that it hosts an obscured starburst. A faint, extended K source is
visible to the south-west of the field centre, this is undetected in
the deep R/I images giving it a very red galaxy indicating that it has
I-K>6 and is thus an Extremely Red Object. This image is created from
R, I and K images, taken with WFPC2/HST, LRIS/Keck and UFTI/UKIRT
respectively.

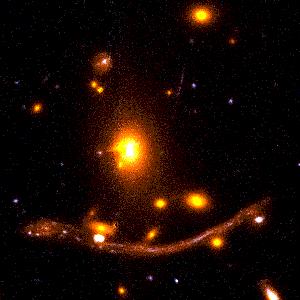
Below: False B/R images of A370 (z=0.37) constructed from the
F702W exposure taken with WFPC2. The full field is 30× 30 arcsec
in size and shows the original `giant' arc - A0 - an image of a lensed
z=0.72 Sbc galaxy. The majority of the arc is made up of an image of
a strongly-sheared region of the galaxy's disk. A fainter radial arc
is also visible above the D galaxy.
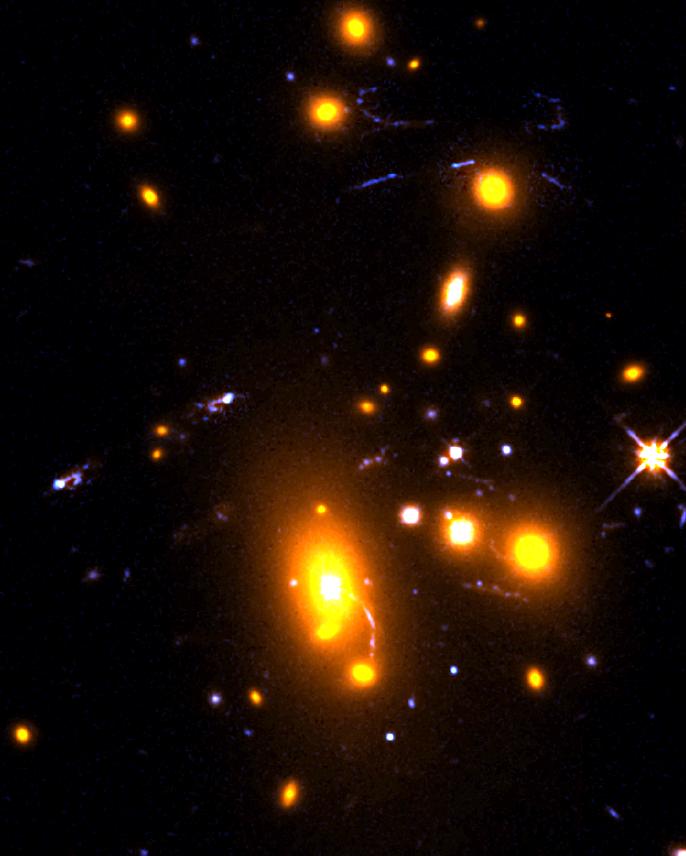
Below: False B/R images of AC114 (z=0.31) constructed
from the F702W exposure taken with WFPC2.
The full field is 70× 50 arcsec in size and shows at least five multiply
imaged background sources at redshifts between 1 and 3. The zoomed version
is more like 30× 40 arcsec. The top two images are for viewing in
a browser, while the bottom two would be better illustrations.

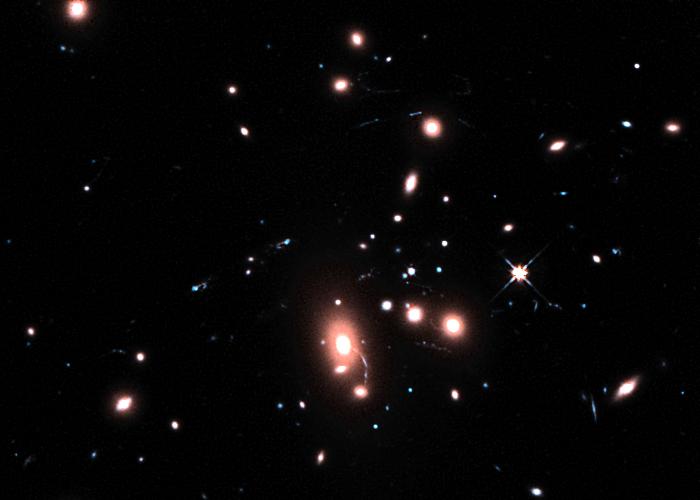
Below: F702W (R) image of MS0440+02 taken with WFPC2.
The scale is in arcseconds and North is at 153 degrees (counterclockwise
from positive Y). The source N1 is the spiral galaxy to the
left and slightly above the central galaxy (that is almost due WEST
of the central galaxy).
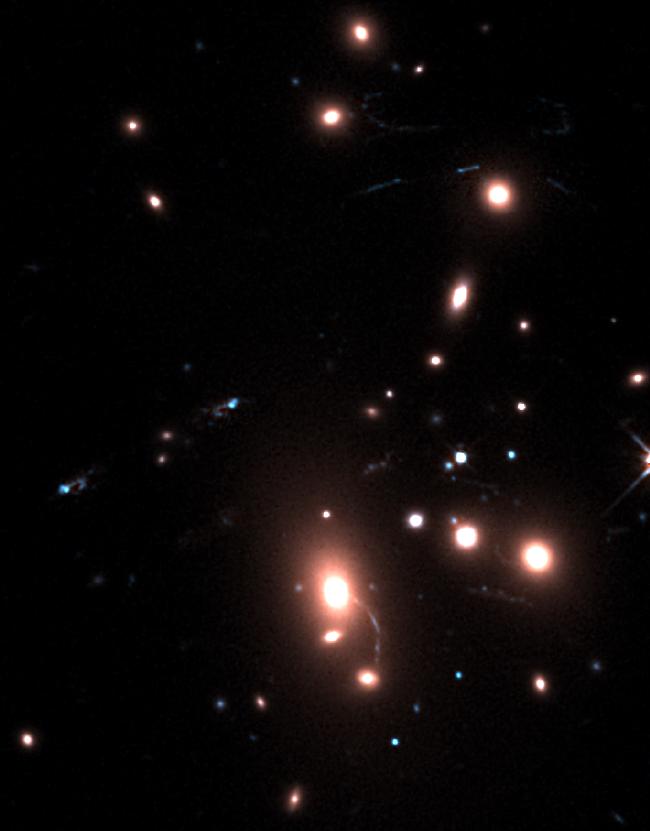
Below: R-band image of A851 taken with P200.
The scale is in arcseconds and North is top with East.
The source H1 is the bright spiral galaxy in the centre of the field
at [115,120] with a bright star directly South-West of it.
These are a 6 orbit WFPC2 F702W exposure (left) and a single orbit NICMOS/NIC-1 F160W (right) exposure of CN#88 (two merging S0/a's, center of field) and CN#87 an interacting Sb galaxy (right) with an early-type disk companion, which has a starburst spectrum. The image in the center shows a `true' color version of the field after slight smoothing. Each panel is 11×11 arcsec.
Right: R-band image of possible
S2 counterpart (z=1.06?). Left: U/R `real' color image.
Each frame is 10×10 arcsec in size.

Left: V/I `real' color image of central galaxy in
A2390 (z=0.23) constructed from deep WFPC2 images. Note the
blue `jets' and several blue knots as well as the wide-spread dust.
The field is 20×20 arcsec in size.
Right: The V image after subtracting a scaled version of the I frame
to remove the halo of the central galaxy.
The blue jets and knots stand out, as does a reddened region to
the North-east of the central galaxy which appears to extend
across the jets (shown as white in this frame).


Last Modified: November 6th, 1999. [Netscape 2.0]