
A 150×150 arcsec (1.1 Mpc square for H=50km/s/Mpc) region of the
HST/WFPC2 image of the distant rich cluster Cl0054-27 (z=0.56) from the
Morphs sample. The cluster is seen as it was roughly 6 billion years
ago. The image is a `real' color representation of the field made by
combining images in Blue and Red filters. Note the massive red
galaxies which dominate the very central regions of the cluster and the
large population of blue disturbed galaxies on the outskirts. In
addition you can see a number of faint blue objects in the very center
of the cluster, these are likely to be images of background galaxies
which are being gravitationally magnified by the mass in the foreground
cluster. These are large, full scale GIF images which may be more easily
viewed if they are downloaded and then manipulated with XV.
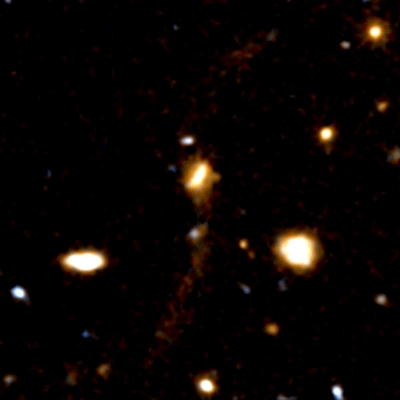
A `harassed' galaxy in the cluster, this is a 20×20 arcsec
(150kpc) section of the above frame showing the faint 100-kpc long
tidal streams emanating from the galaxy.
The full frame HST/WFPC2 image of the
distant rich cluster Cl0016+16 (z=0.55) from the Morphs sample,
corresponding to 1.1 Mpc across at the cluster for H=50km/s/Mpc. The
cluster galaxies are viewed as they were roughly 6 billion years ago.
The image is a `real' color representation of the field made by
combining images in Blue and Red filters. Note the massive red
galaxies which dominate the very central regions of the cluster
(bottom-left) and the large population of blue disturbed and
interacting galaxies on the outskirts.
The distant cluster Cl0412-65 (z=0.51) from the Morphs sample
shown as a `true' color image from the HST/WFPC2 F555W/F814W
exposures. Again the field of view
corresponds to 1.1 Mpc at the cluster redshift for H=50km/s/Mpc. Note the
low surface brightness galaxies seen in the central regions of the
cluster. The redshift of these features are of particular interest to
understanding the evolution of the cluster population and the role
of dynamical processes in changing the morphologies of cluster
galaxies over the last 6 Gyrs.
HST/WFPC2 `real' color
images of confirmed members in three z=0.55 clusters. These are
6×6 mosaics objects from the Morphs samples. The
individual subimages are each 7 arcsec across (70 pixels square = 52 kpc at
the cluster distance using H=50km/s/Mpc). The two images have different
stretches.
HST/WFPC2 images of confirmed members of z=0.4 clusters. These are
5×5 mosaics of emission line objects from the Morphs samples. The
individual subimages are each 5 arcsec (50 pixels square = 32 kpc at
the cluster distance using H=50km/s/Mpc).
Last Modified: April 25th, 1997. [Netscape 2.0]
HOME PAGE